
Power Automate - Streamline cloud flow debugging and monitoring with Application insight


Power Automate Could Flow is one of my favourite services in Power Platform. It's a great tool for creating automated workflow to help streamline the business process.
However, troubleshooting Power Automate cloud flow can be troublesome especially when you have a growing number of cloud flows created in your environment or maybe you just want to gather all the cloud flows related errors in a specific time frame.
The good news is that Microsoft has recently released a new preview feature to allow Power Platform admin to export all cloud flow and Datatverse related telemetry data into application insight.
Application insight is an extension of Azure Monitor solution that focuses on monitoring and diagnosing application performance. Following are some key features of application insight:
Application Telemetry Collection
Performance Monitoring
Error and Exception Tracking
Alerts and Notifications
Dashboards and Reports
The ability to export all clould flow related data into application insight empowers Power Platform admin to centralize all cloud flow information in one place. This functionality further facilitates the customization of data analysis, allowing for seamless data manipulation according to individual preferences. No more clicking through "hundreds of" links to troubleshoot your cloud flow issues. 🎉🎉🎉🎉🎉🎉🎉
But before getting too excited about this new feature, I need to point out that this new feature is for managed Environments only. Currently, however, it is available to all environments as it is in the public preview stage.
Export Data
The way to export cloud flow telemetry data to your application insight is pretty straightforward.
Firstly you need to make sure that your account has one of the following roles assigned: Power Platform Admin, Dynamics 365 Admin, Microsoft 365 Global Admin.
Then you need to set up an application Insights from Azure Portal to receive the data for every single environment that you want to monitor. The out-of-box application insight report won't be accurate if we pipe telemetry data from multiple environments into the same application insights. Click here for more information about how to set up an application insight if you've never done it before.
Note: I highly recommend creating a dedicated application insight for each environment as it will simplify the data query and eliminate extra noise from other applications.
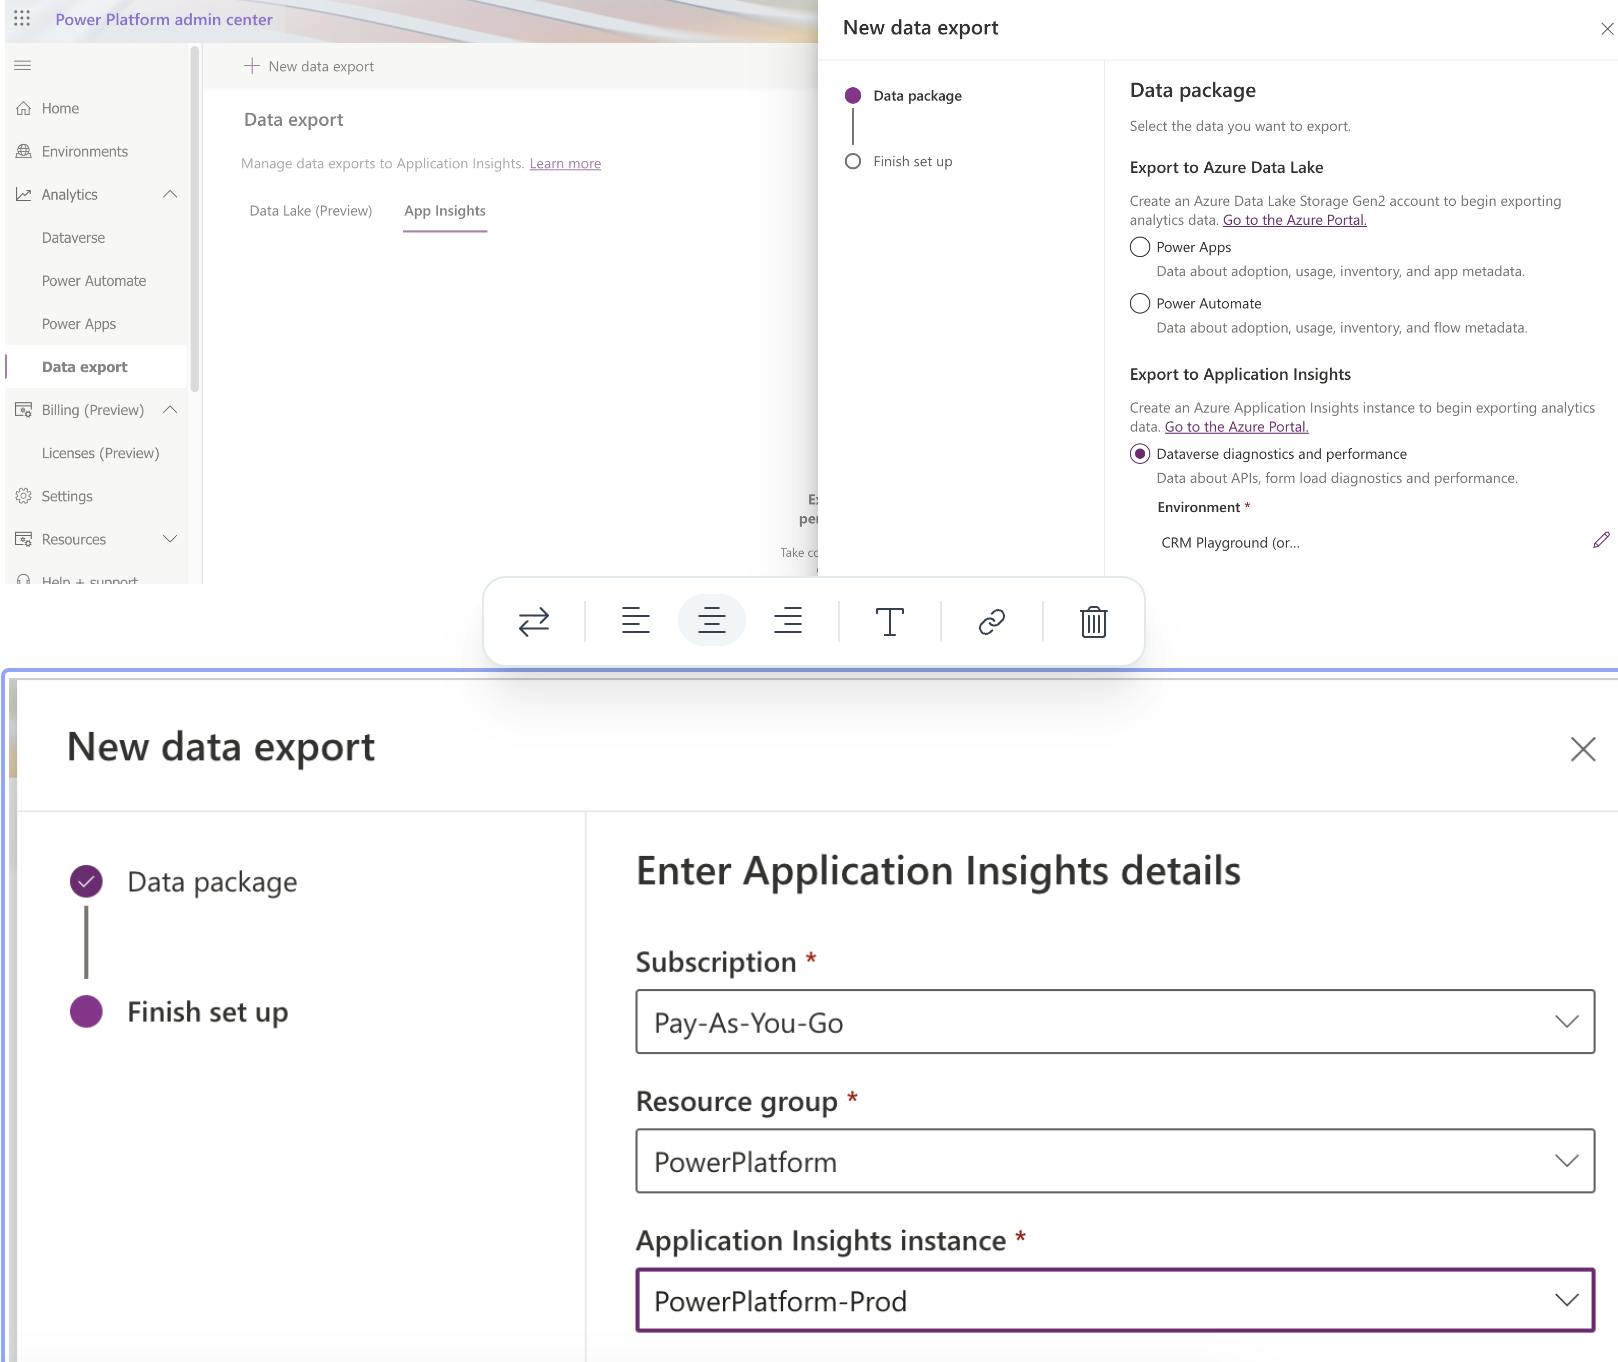
Once application insight is set up, navigate to the Power Platform admin centre where you can find Data export -> App Insights

Click on the + New data export button to create a new data export task. Make sure you provide a meaningful name here as all data export tasks will be listed together. Under the Power Automate option, check all checkboxes below to get all available telemetry data from cloud flow.

Note: If you saw the below UI in your tenant, it's likely that this feature has not yet been rolled out to your tenant.
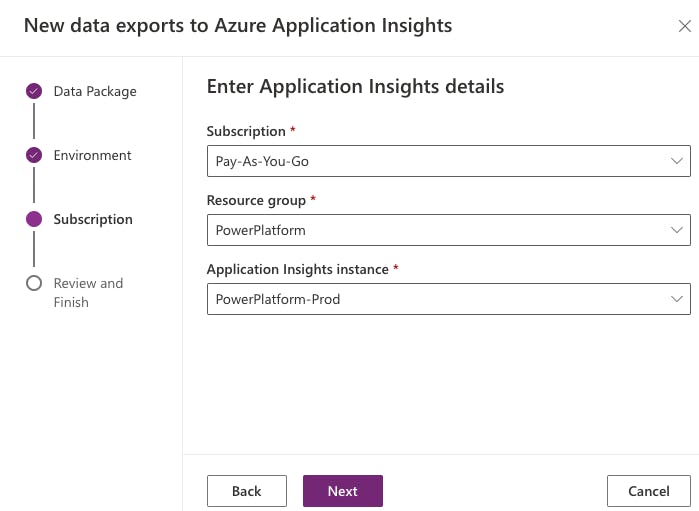
Next, click on the next button to select the managed environment

As mentioned above, you can find all your environments in this list at the moment because this feature is still in public preview.
On the next page, select the application insights instance you've just created.
Confirm the configuration before clicking on the Create button.
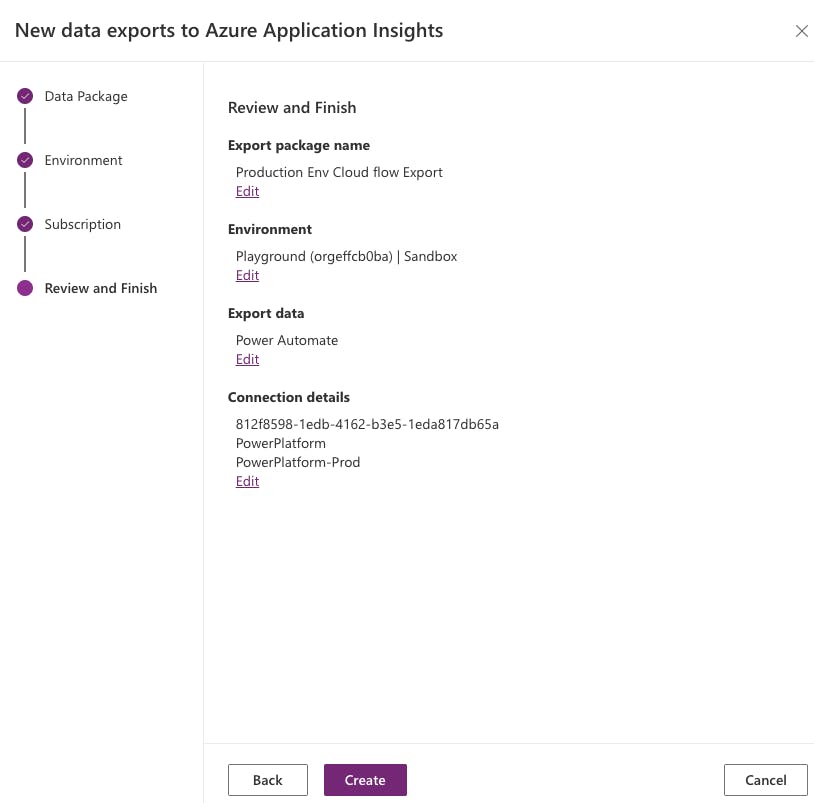
That's it! I've created the data export between Power Automate and your application insight instance. This will be a continuous export until you remove the mapping.
Telemetry data
There are some generic tables provided in application insight that consume telemetry data from different sources (applications/services).
The telemetry from the Power Automate cloud flow will flow into the following two tables:
Requests - Provide details on Cloud flow instance Level
Dependencies - Provide details on Action Level
By default, Application Insight has pre-generated some custom queries and charts that will give you an overview of all the failures of your application. You can access that information from the Failures section:
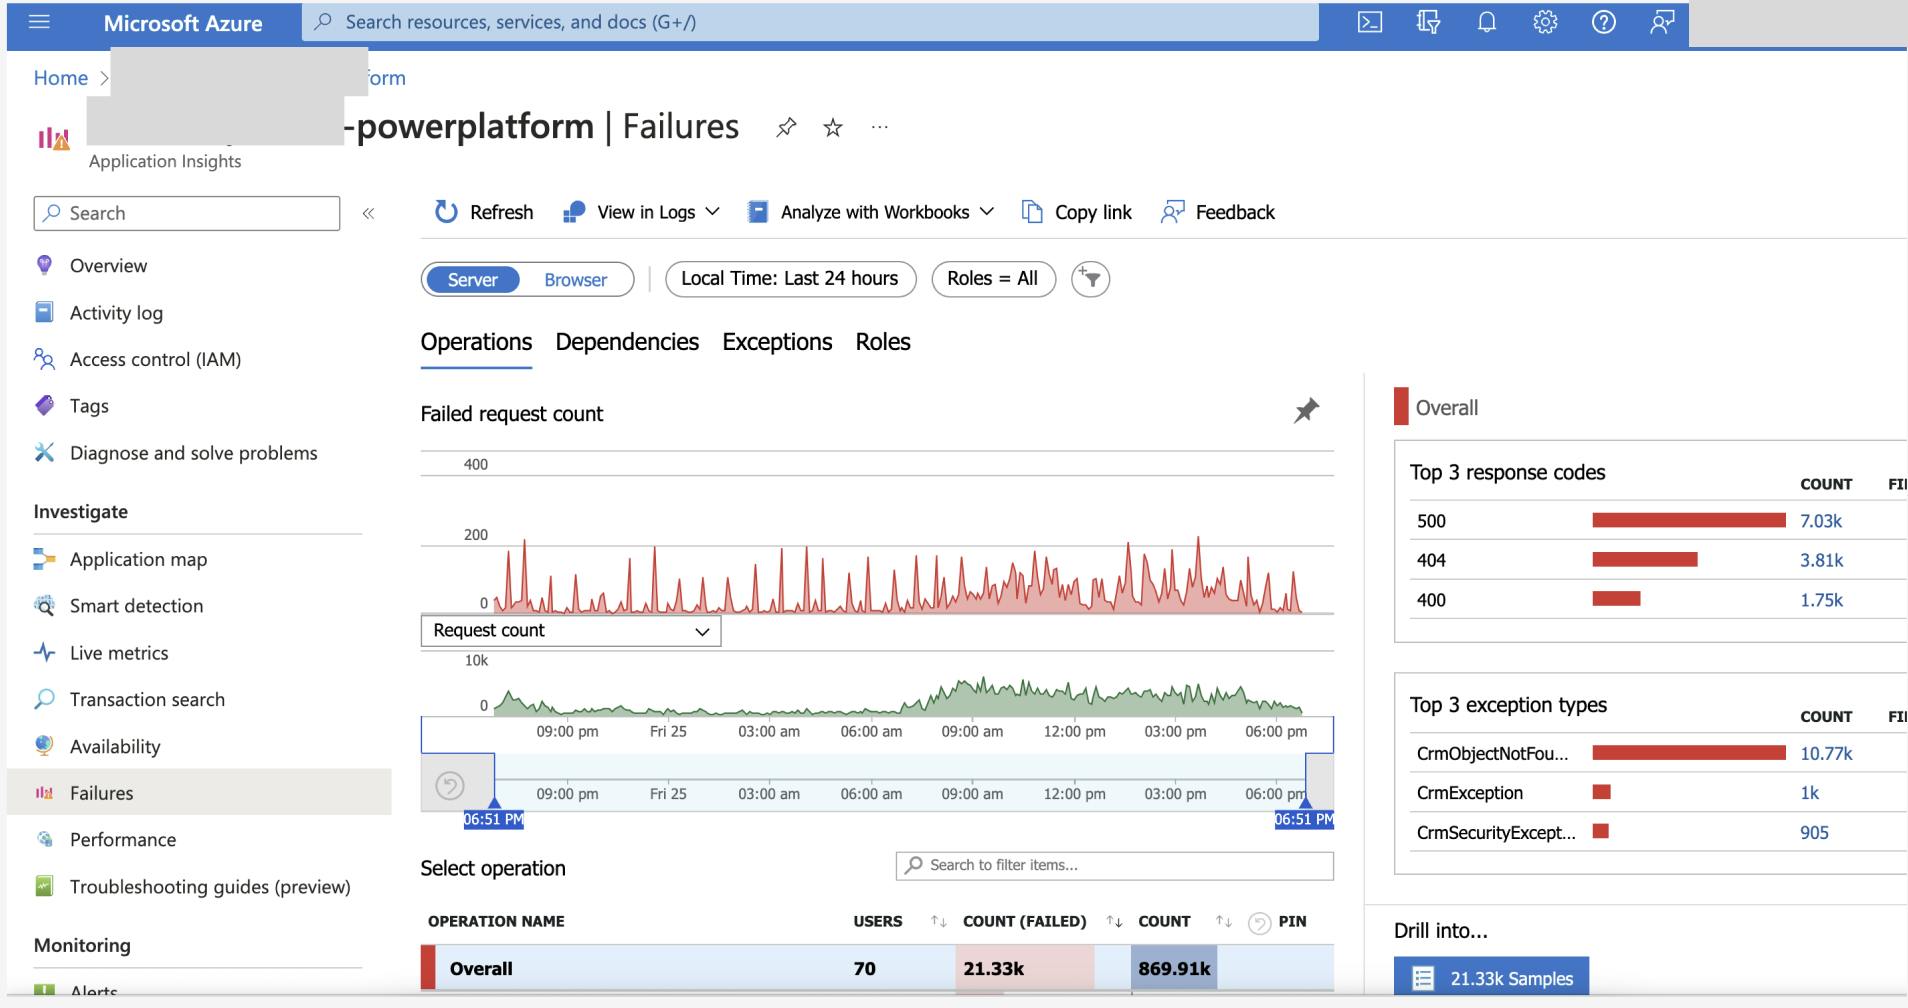
By clicking on the diagram, you can further filter the log provided by the out-of-the-box query. However, that didn't give us enough detail on cloud flow, isn't it? Don't worry, we can achieve that by querying the Request or Dependency table using a custom query.

To create a custom query, navigate to the logs section. The pop-up window will show you all the queries that are available in your app insight:
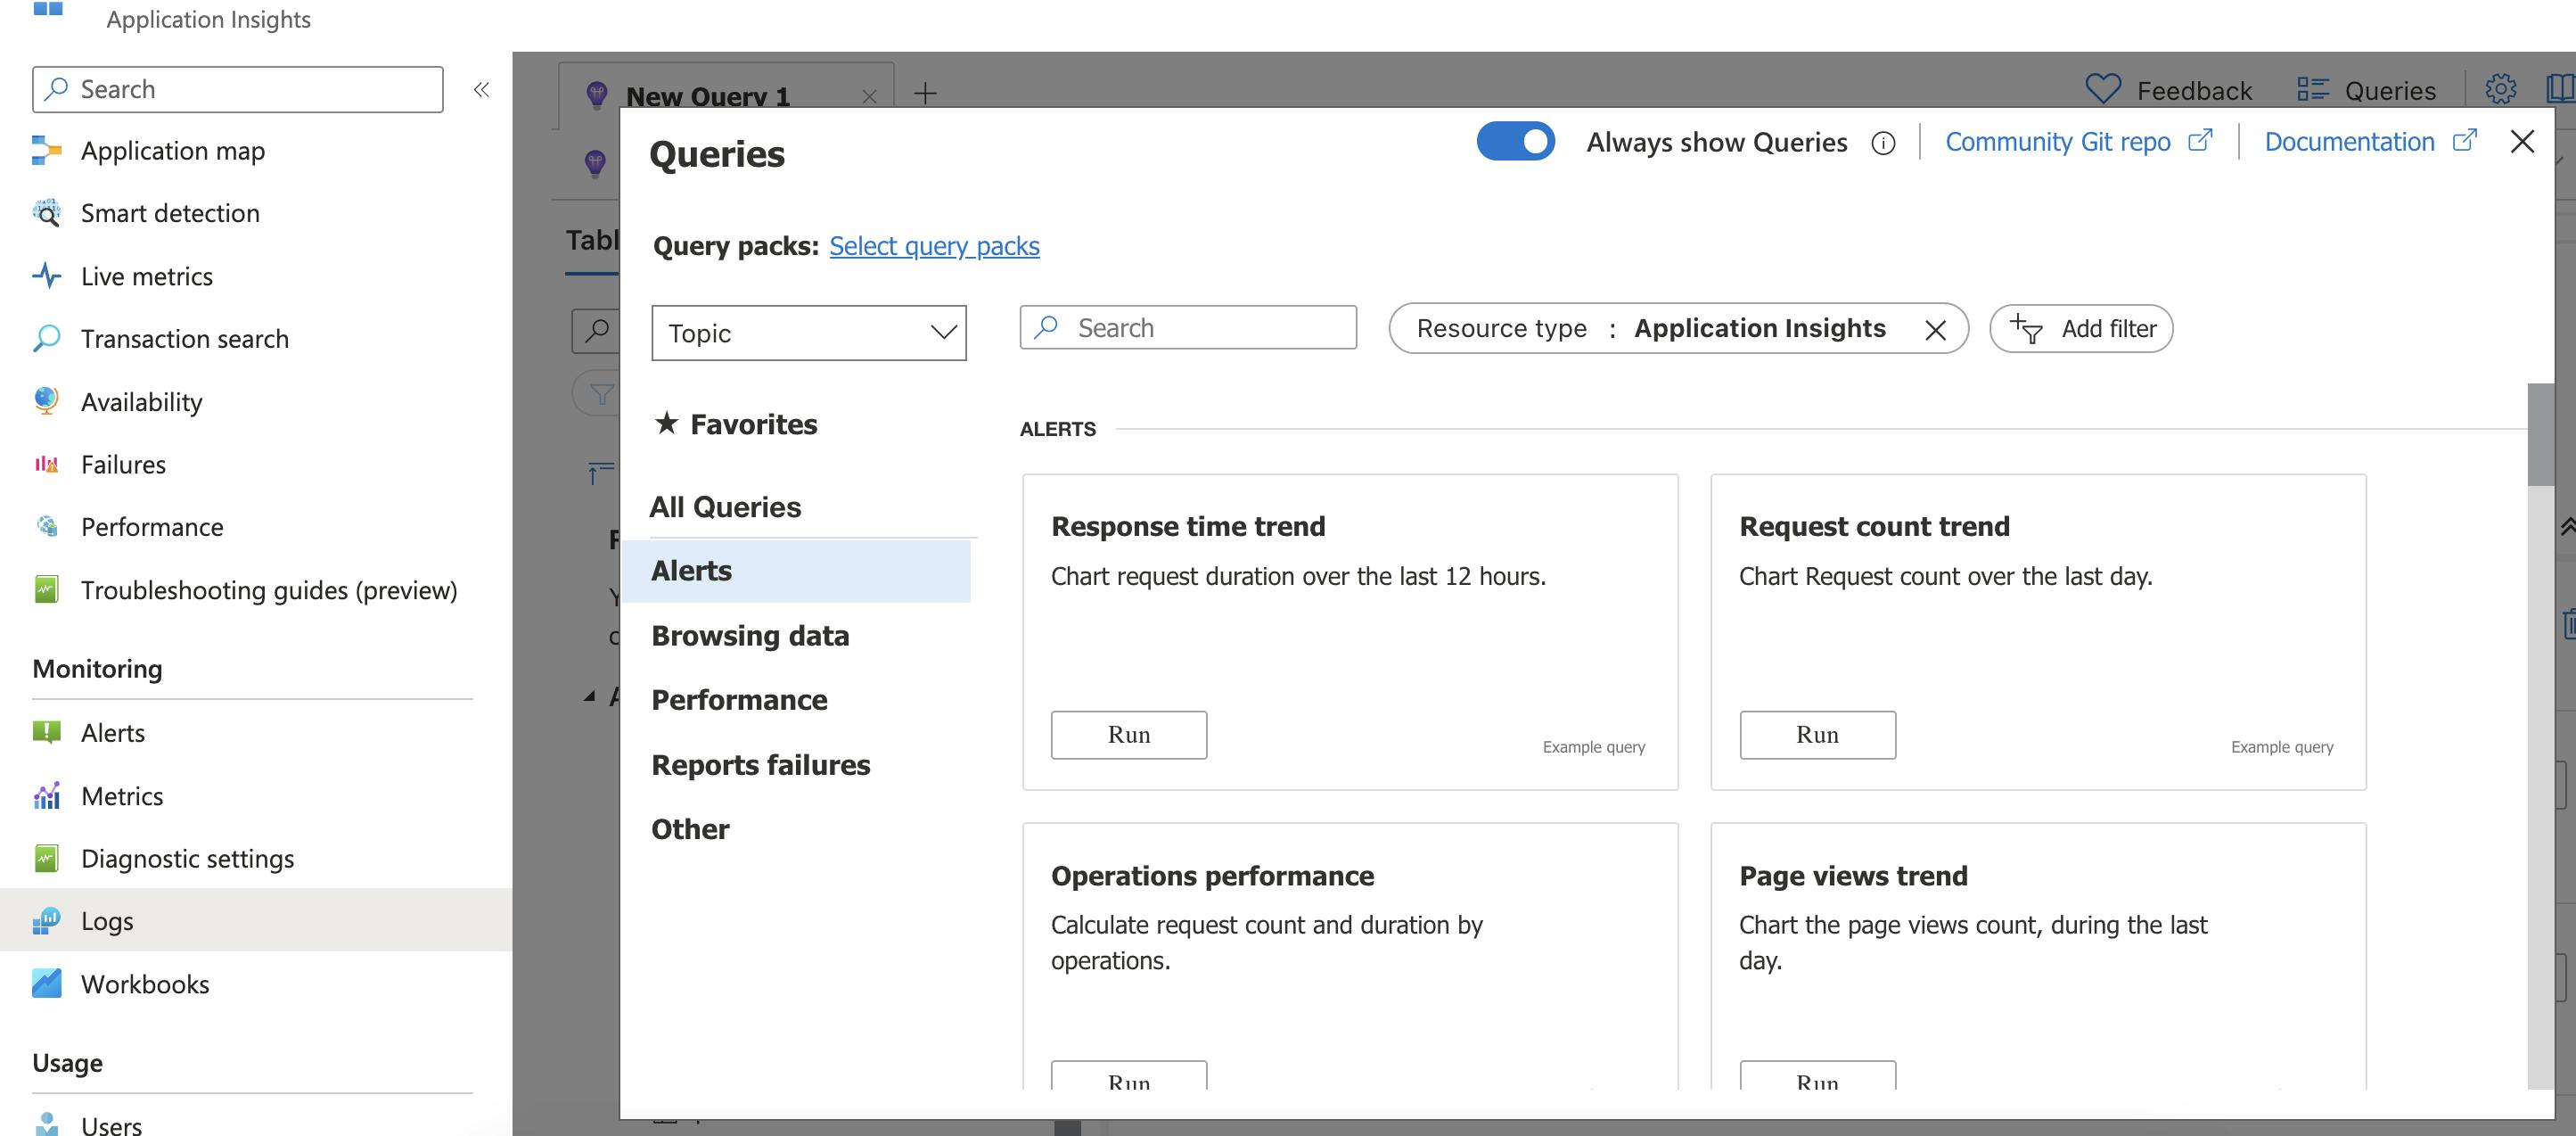
Close the popup for now so that you can write your own query in the query tab:
KQL is the query language that can be used here. It is designed for querying large volumes of structured and semi-structured data. (like logs and telemetry data) Click here if you need more information.
I've provided one of my favourite queries below which can return all the workflow instance that is in fail status and provide a link to the failed workflow instance:
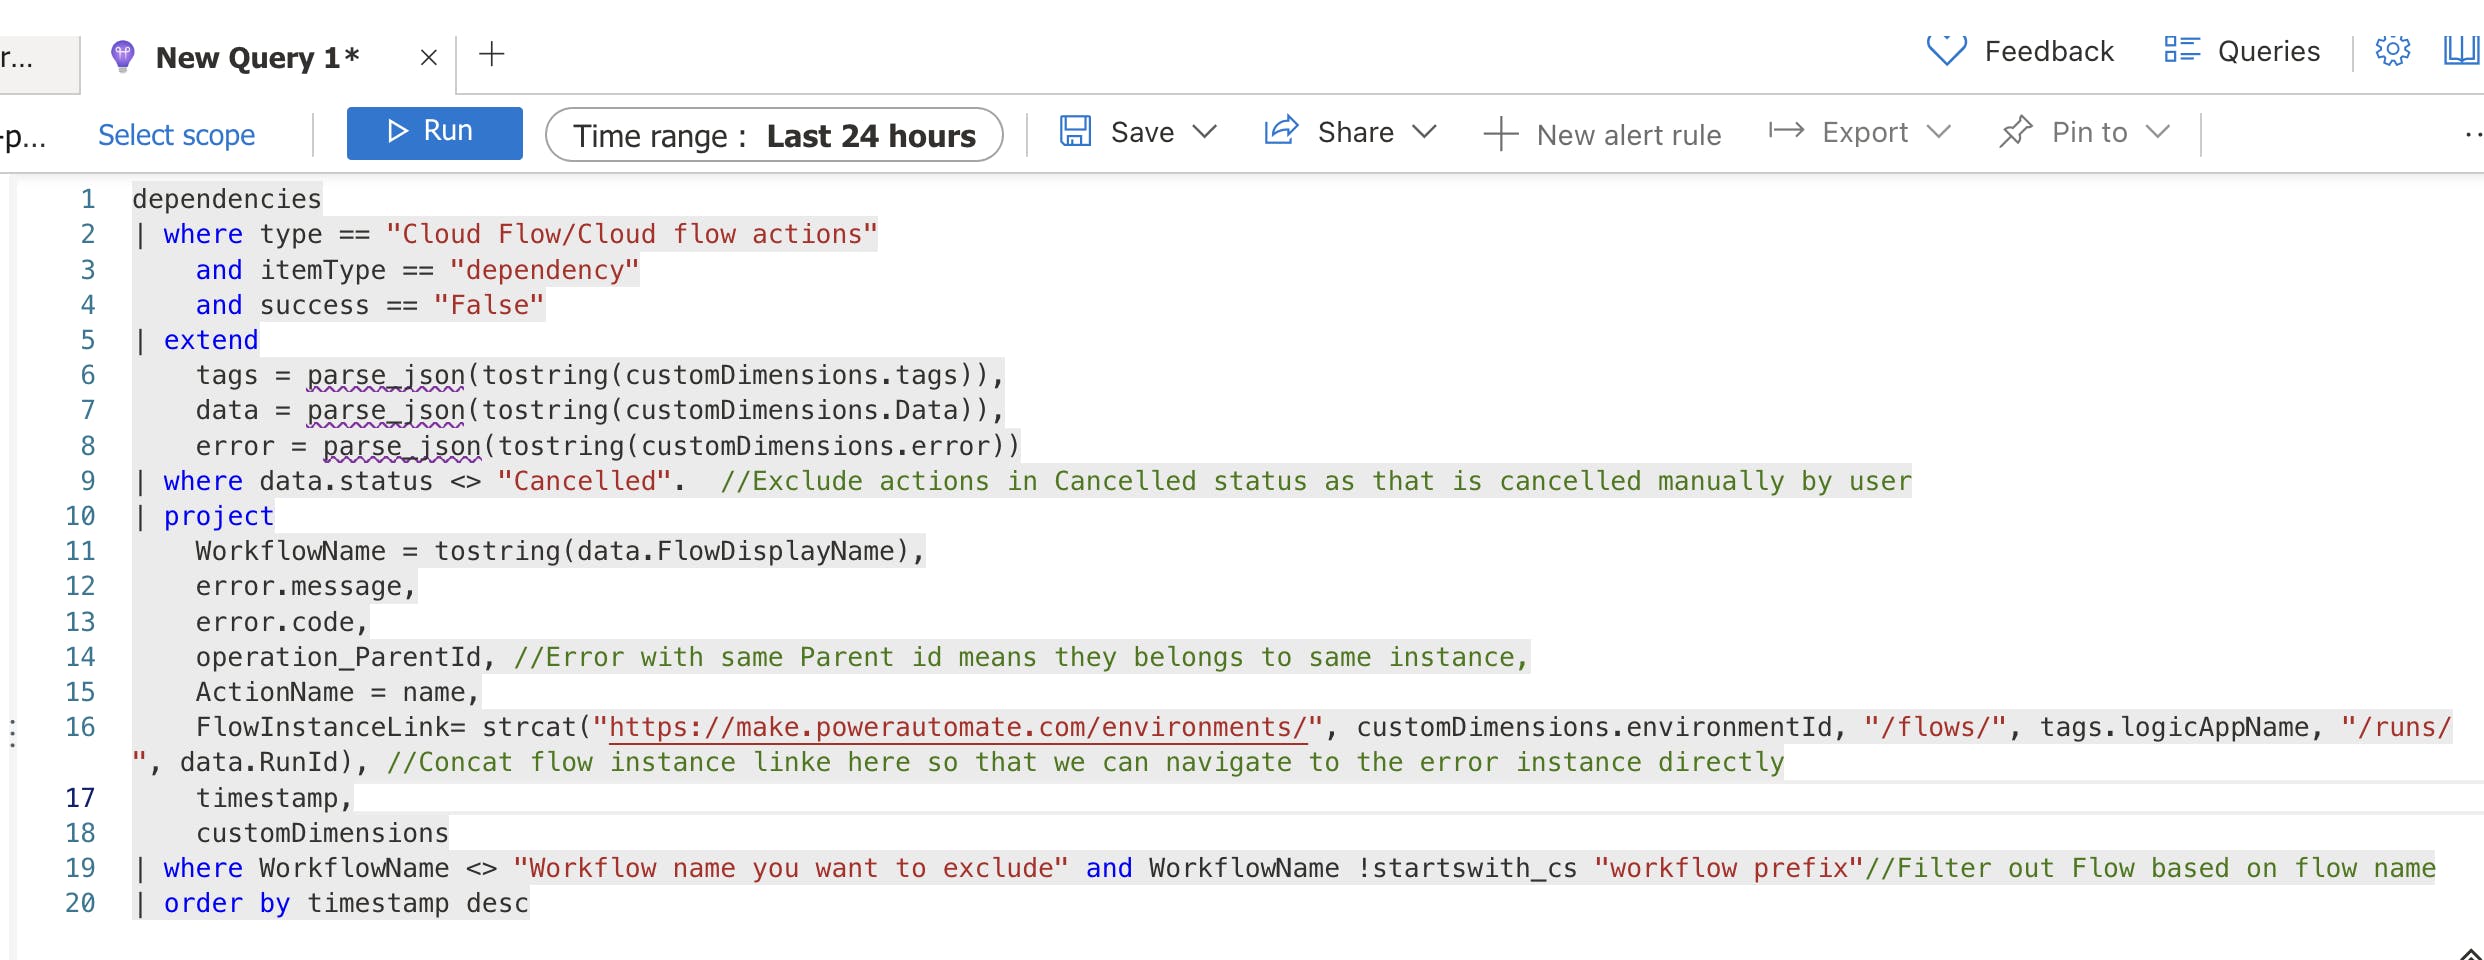
dependencies | where type == "Cloud Flow/Cloud flow actions" and itemType == "dependency" and success == "False" | extend tags = parse_json(tostring(customDimensions.tags)), data = parse_json(tostring(customDimensions.Data)), error = parse_json(tostring(customDimensions.error)) | where data.status <> "Cancelled". //Exclude actions in Cancelled status as that is cancelled manually by user | project WorkflowName = tostring(data.FlowDisplayName), error.message, error.code, operation_ParentId, //Error with same Parent id means they belongs to same instance, ActionName = name, FlowInstanceLink= strcat("https://make.powerautomate.com/environments/", customDimensions.environmentId, "/flows/", tags.logicAppName, "/runs/", data.RunId), //Concat flow instance linke here so that we can navigate to the error instance directly timestamp, customDimensions | where WorkflowName <> "Workflow name you want to exclude" and WorkflowName !startswith_cs "workflow prefix"//Filter out Flow based on flow name | order by timestamp desc
Here I am running the query based on the dependencies table as it provides action-level detail which means we can understand at which action the error happened. (This is based on my usage till now but could change in the future) I understand that it will introduce extra action-related data and that's why we only project necessary property from the table.
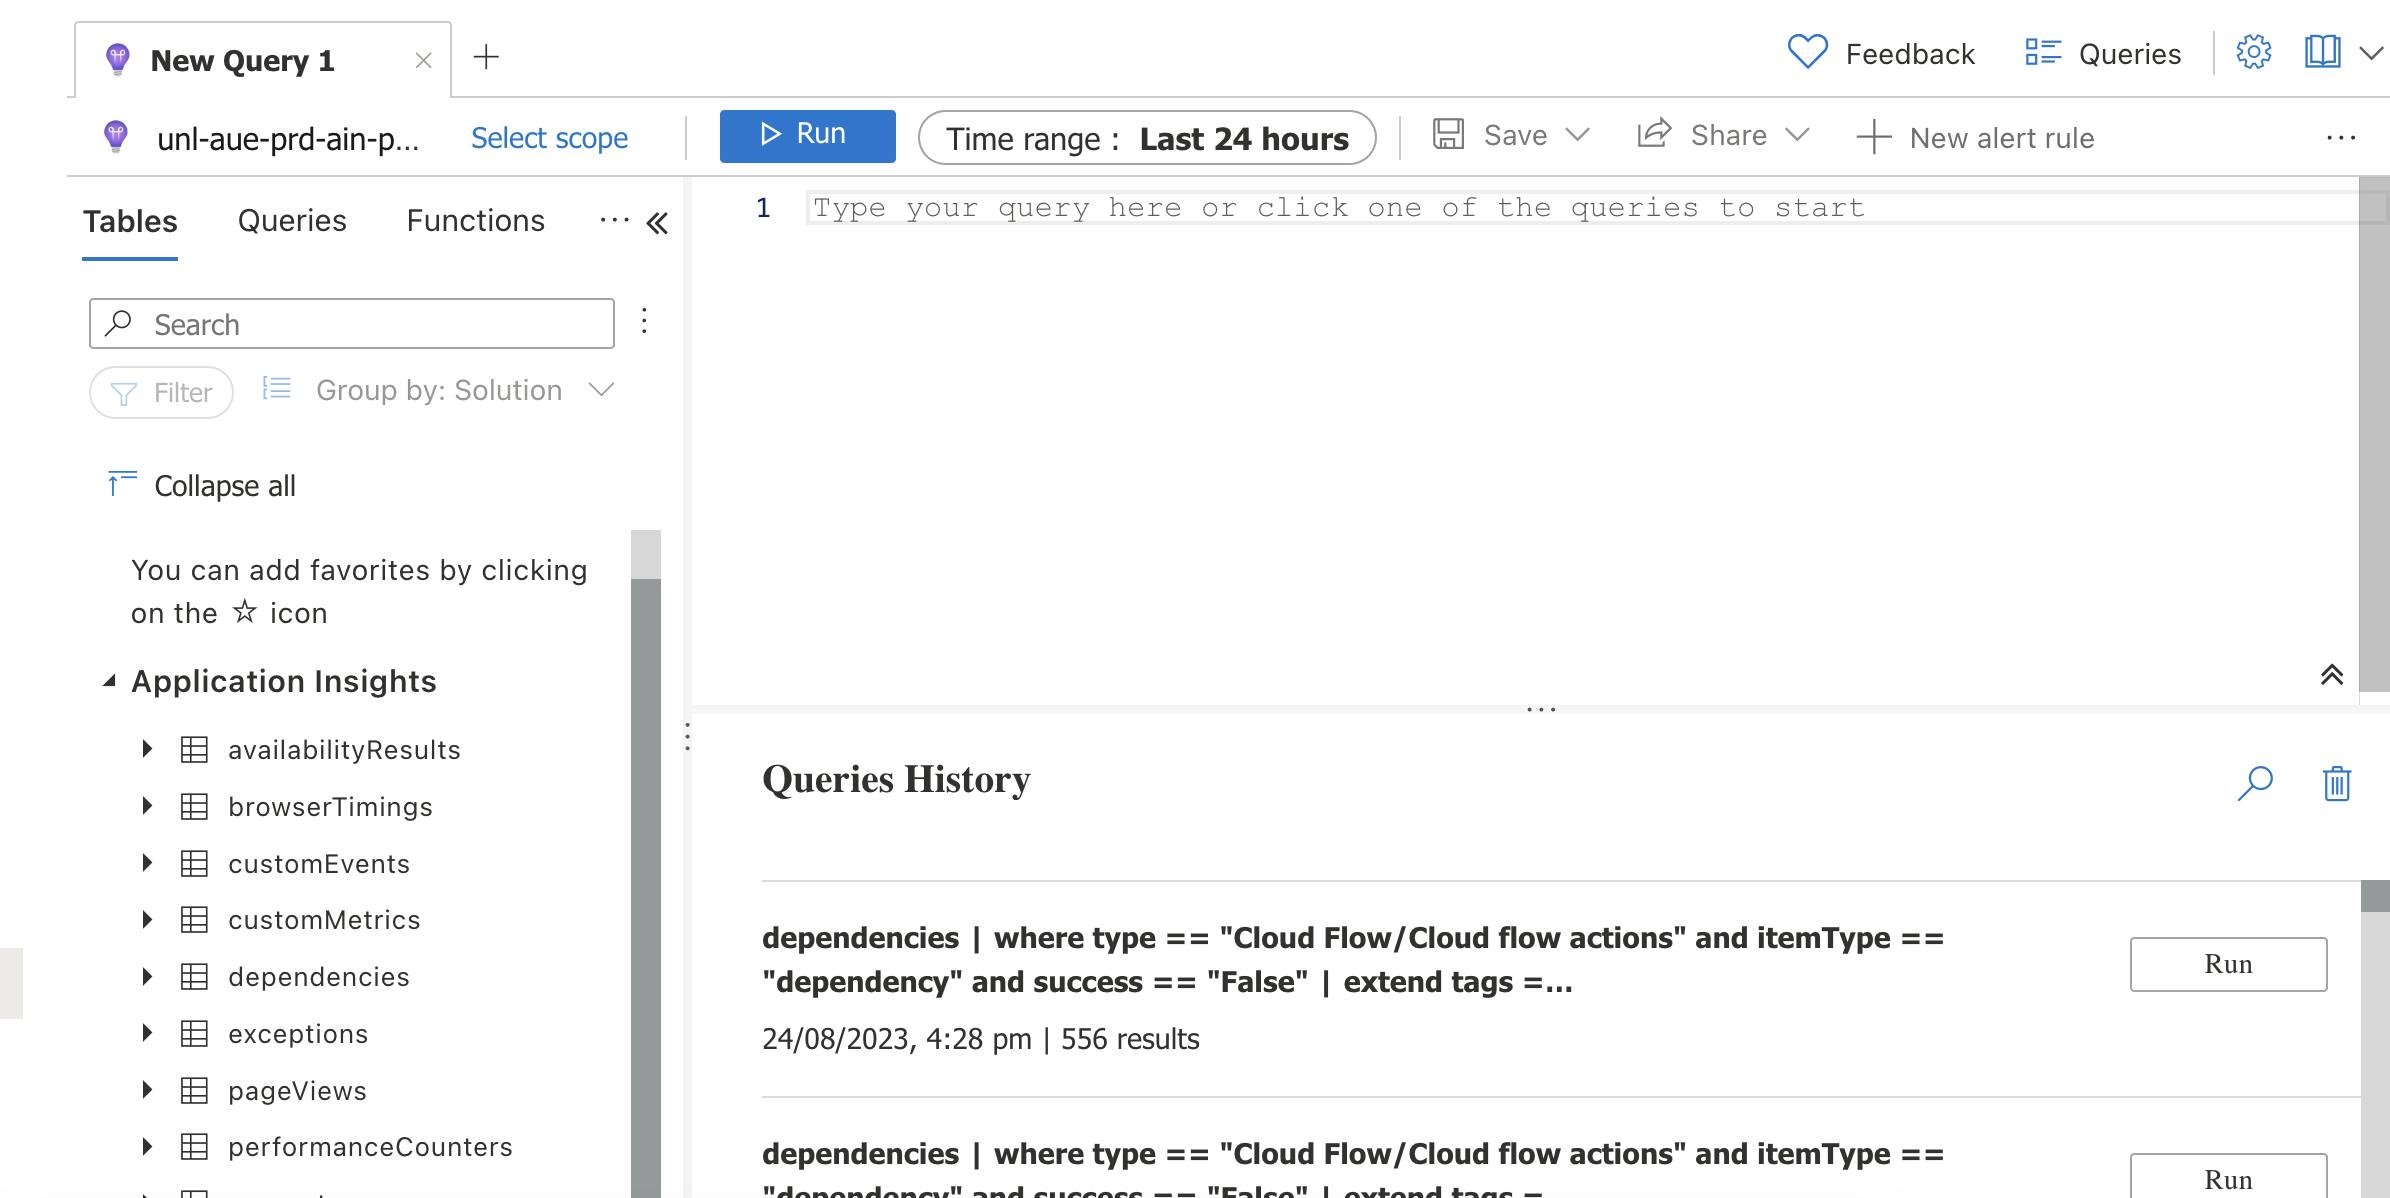
We can change the time range for the query and then click on the Run button to generate the result:


In the result section, click on the Columns button on the right to group Results based on the Workflow Name and Operation_ParentId columns. Here Operation_Parentid is the workflow instance id. By grouping the result based on workflow name and Operation_ParentId, we can get an overview of failures for each cloud flow in the specific time range and at the same time, we can drill down to the action level to understand which action is causing the error and what is the error message:

And since the workflow instance link is generated, we can quickly navigate to the failed instance to troubleshoot further. Finally, you don't need to keep scrolling down from the Power Automate portal to find the right instance. ✌️✌️✌️✌️
If you used to work with KQL, please play around with the query and try to come up with your favourite script and share it in the comments. Microsoft has also provided some useful queries as well which are available just now. Click here for more details.
What's next?
Once you created your favourite query, the next step would be to generate alert rules to automate the query and notification action. With the alert rule, application insight can automatically query the table based on your query logic and notify the pre-defined user when the query result is aligned with the defined criteria. To create an alert rule, simply click on the New alert rule button and follow the wizard. Click here for more details.

Summary
By exporting cloud flow telemetry data to Application Insights, Power Platform administrators can achieve streamlined monitoring of the expanding numbers of cloud flows while significantly simplifying the troubleshooting process. Notably, Application Insights offers a lot of additional features that further augment this experience which is not covered in this post.
Comment below if you want me to provide more content related to this topic.
As always, happy sharing 🤝🤝🤝🤝